Understanding Bacteria Sampling
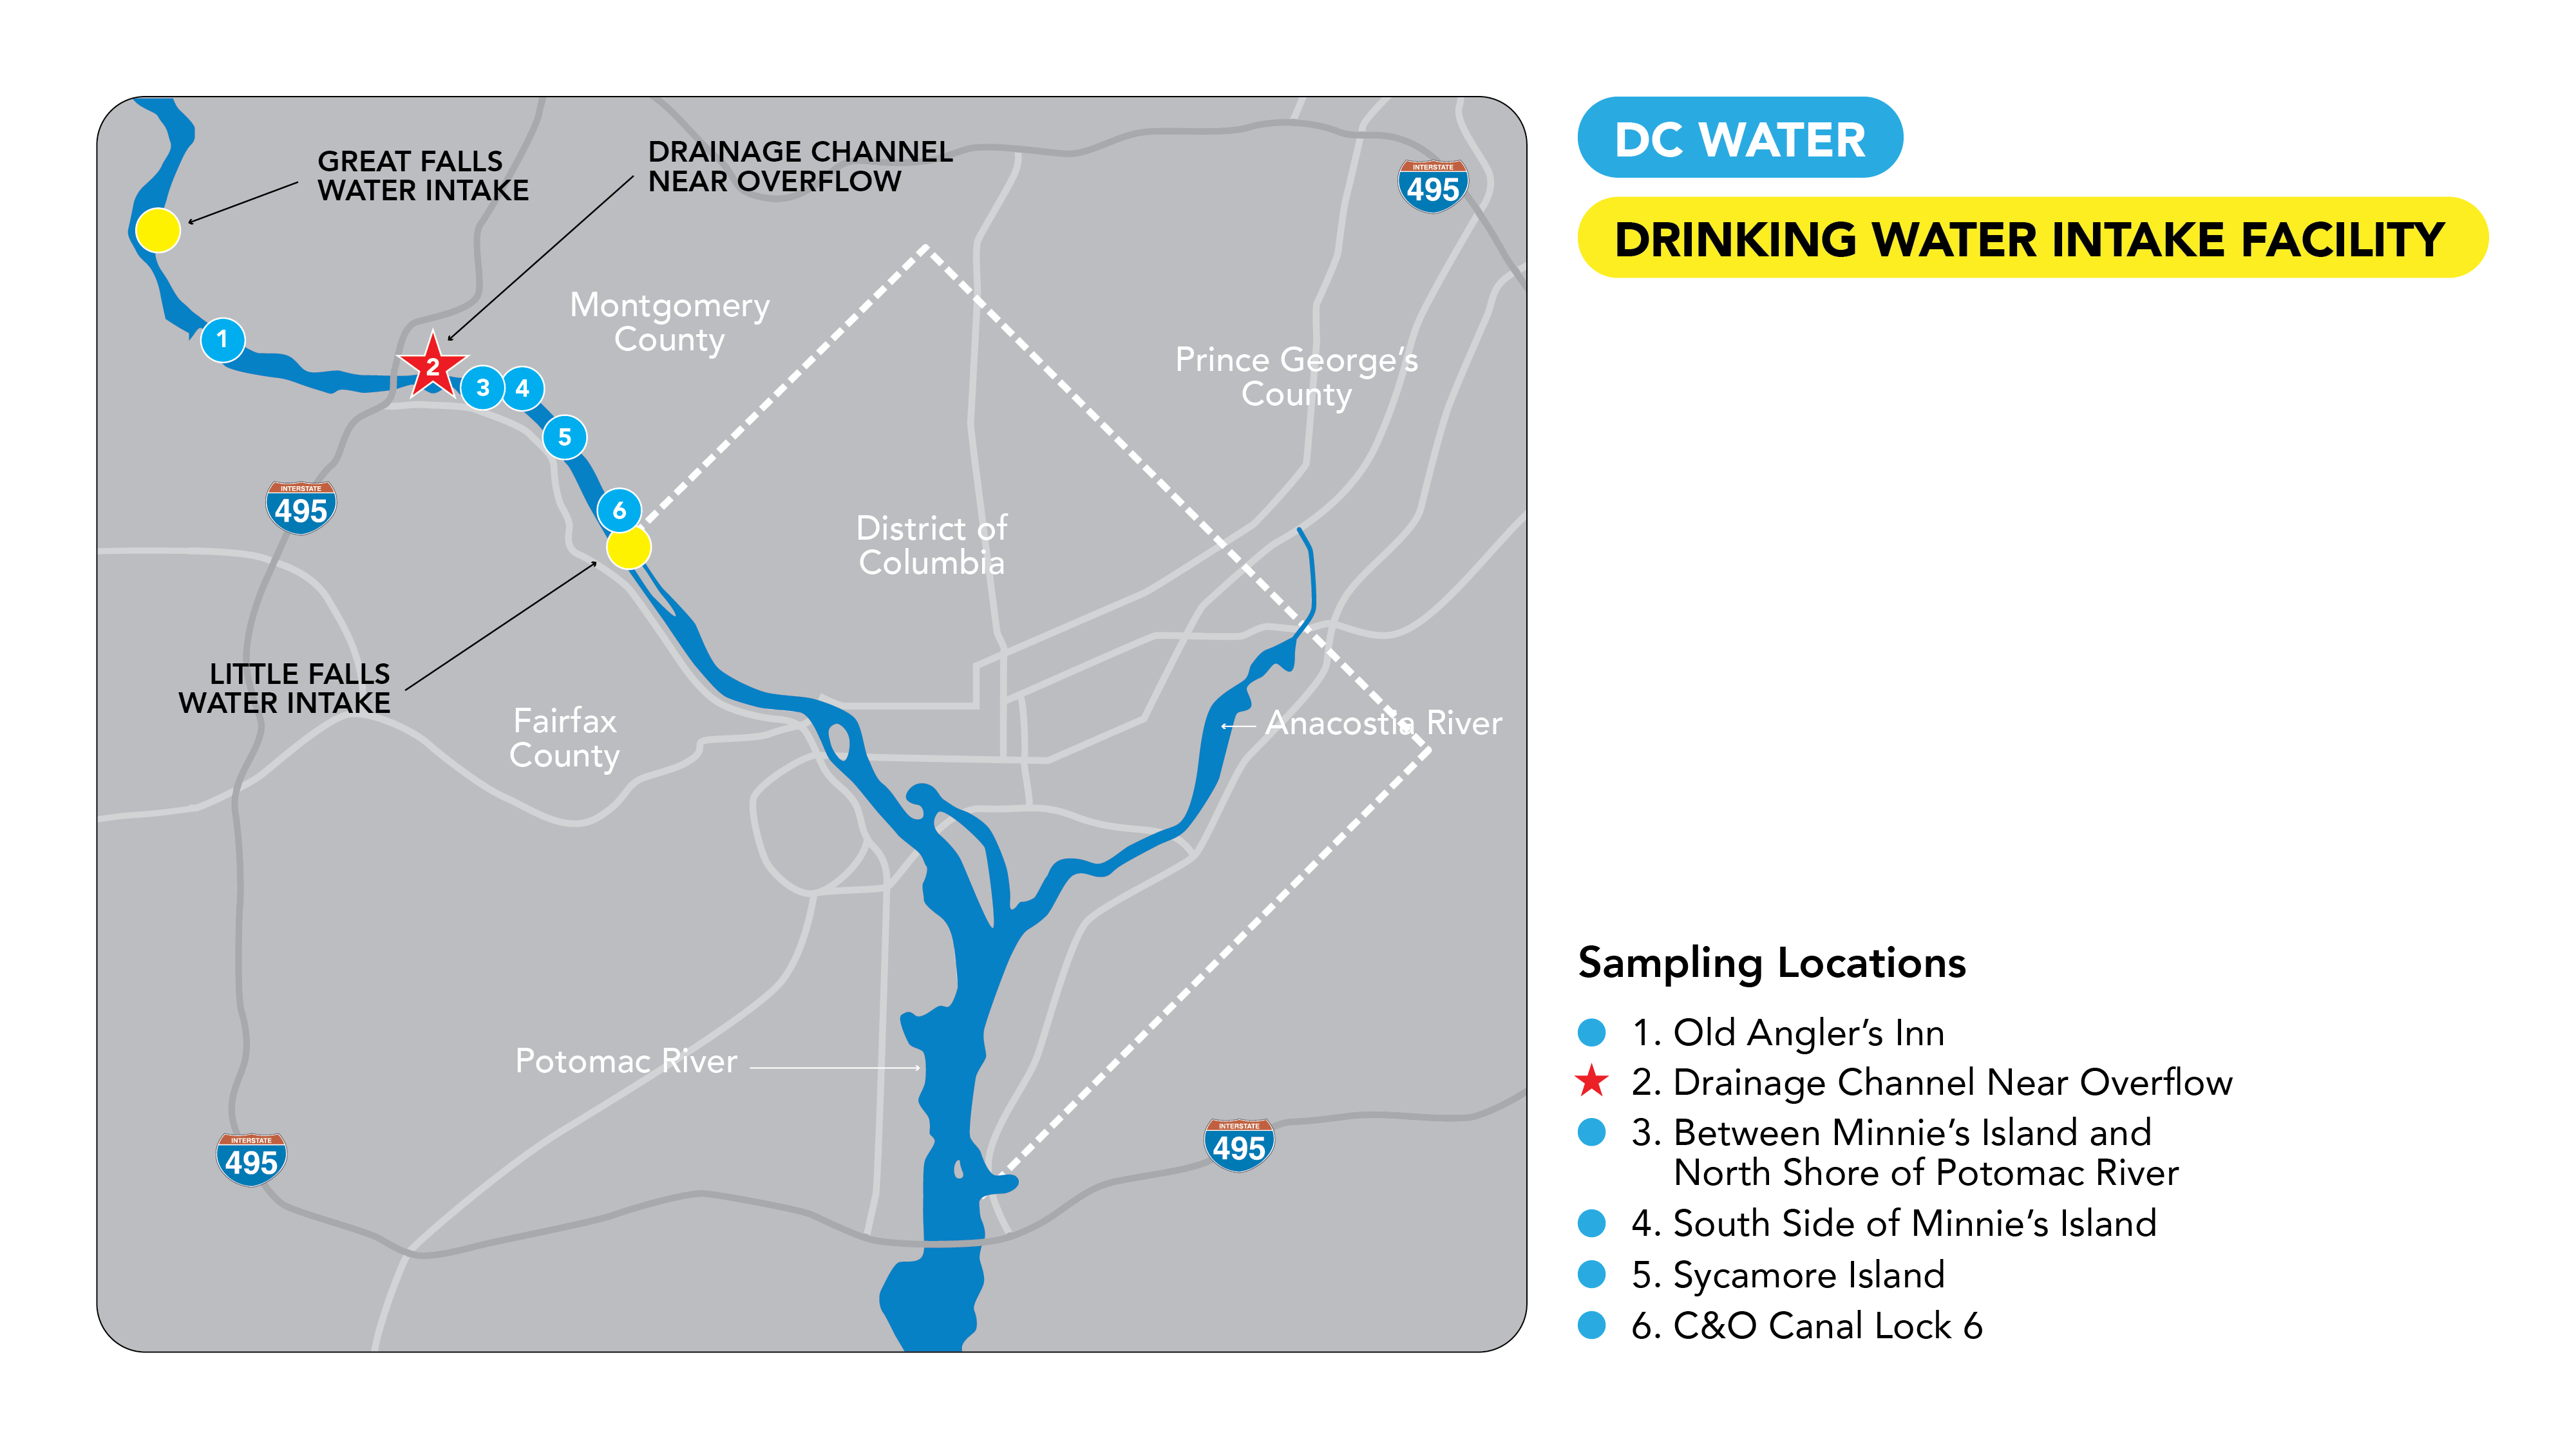
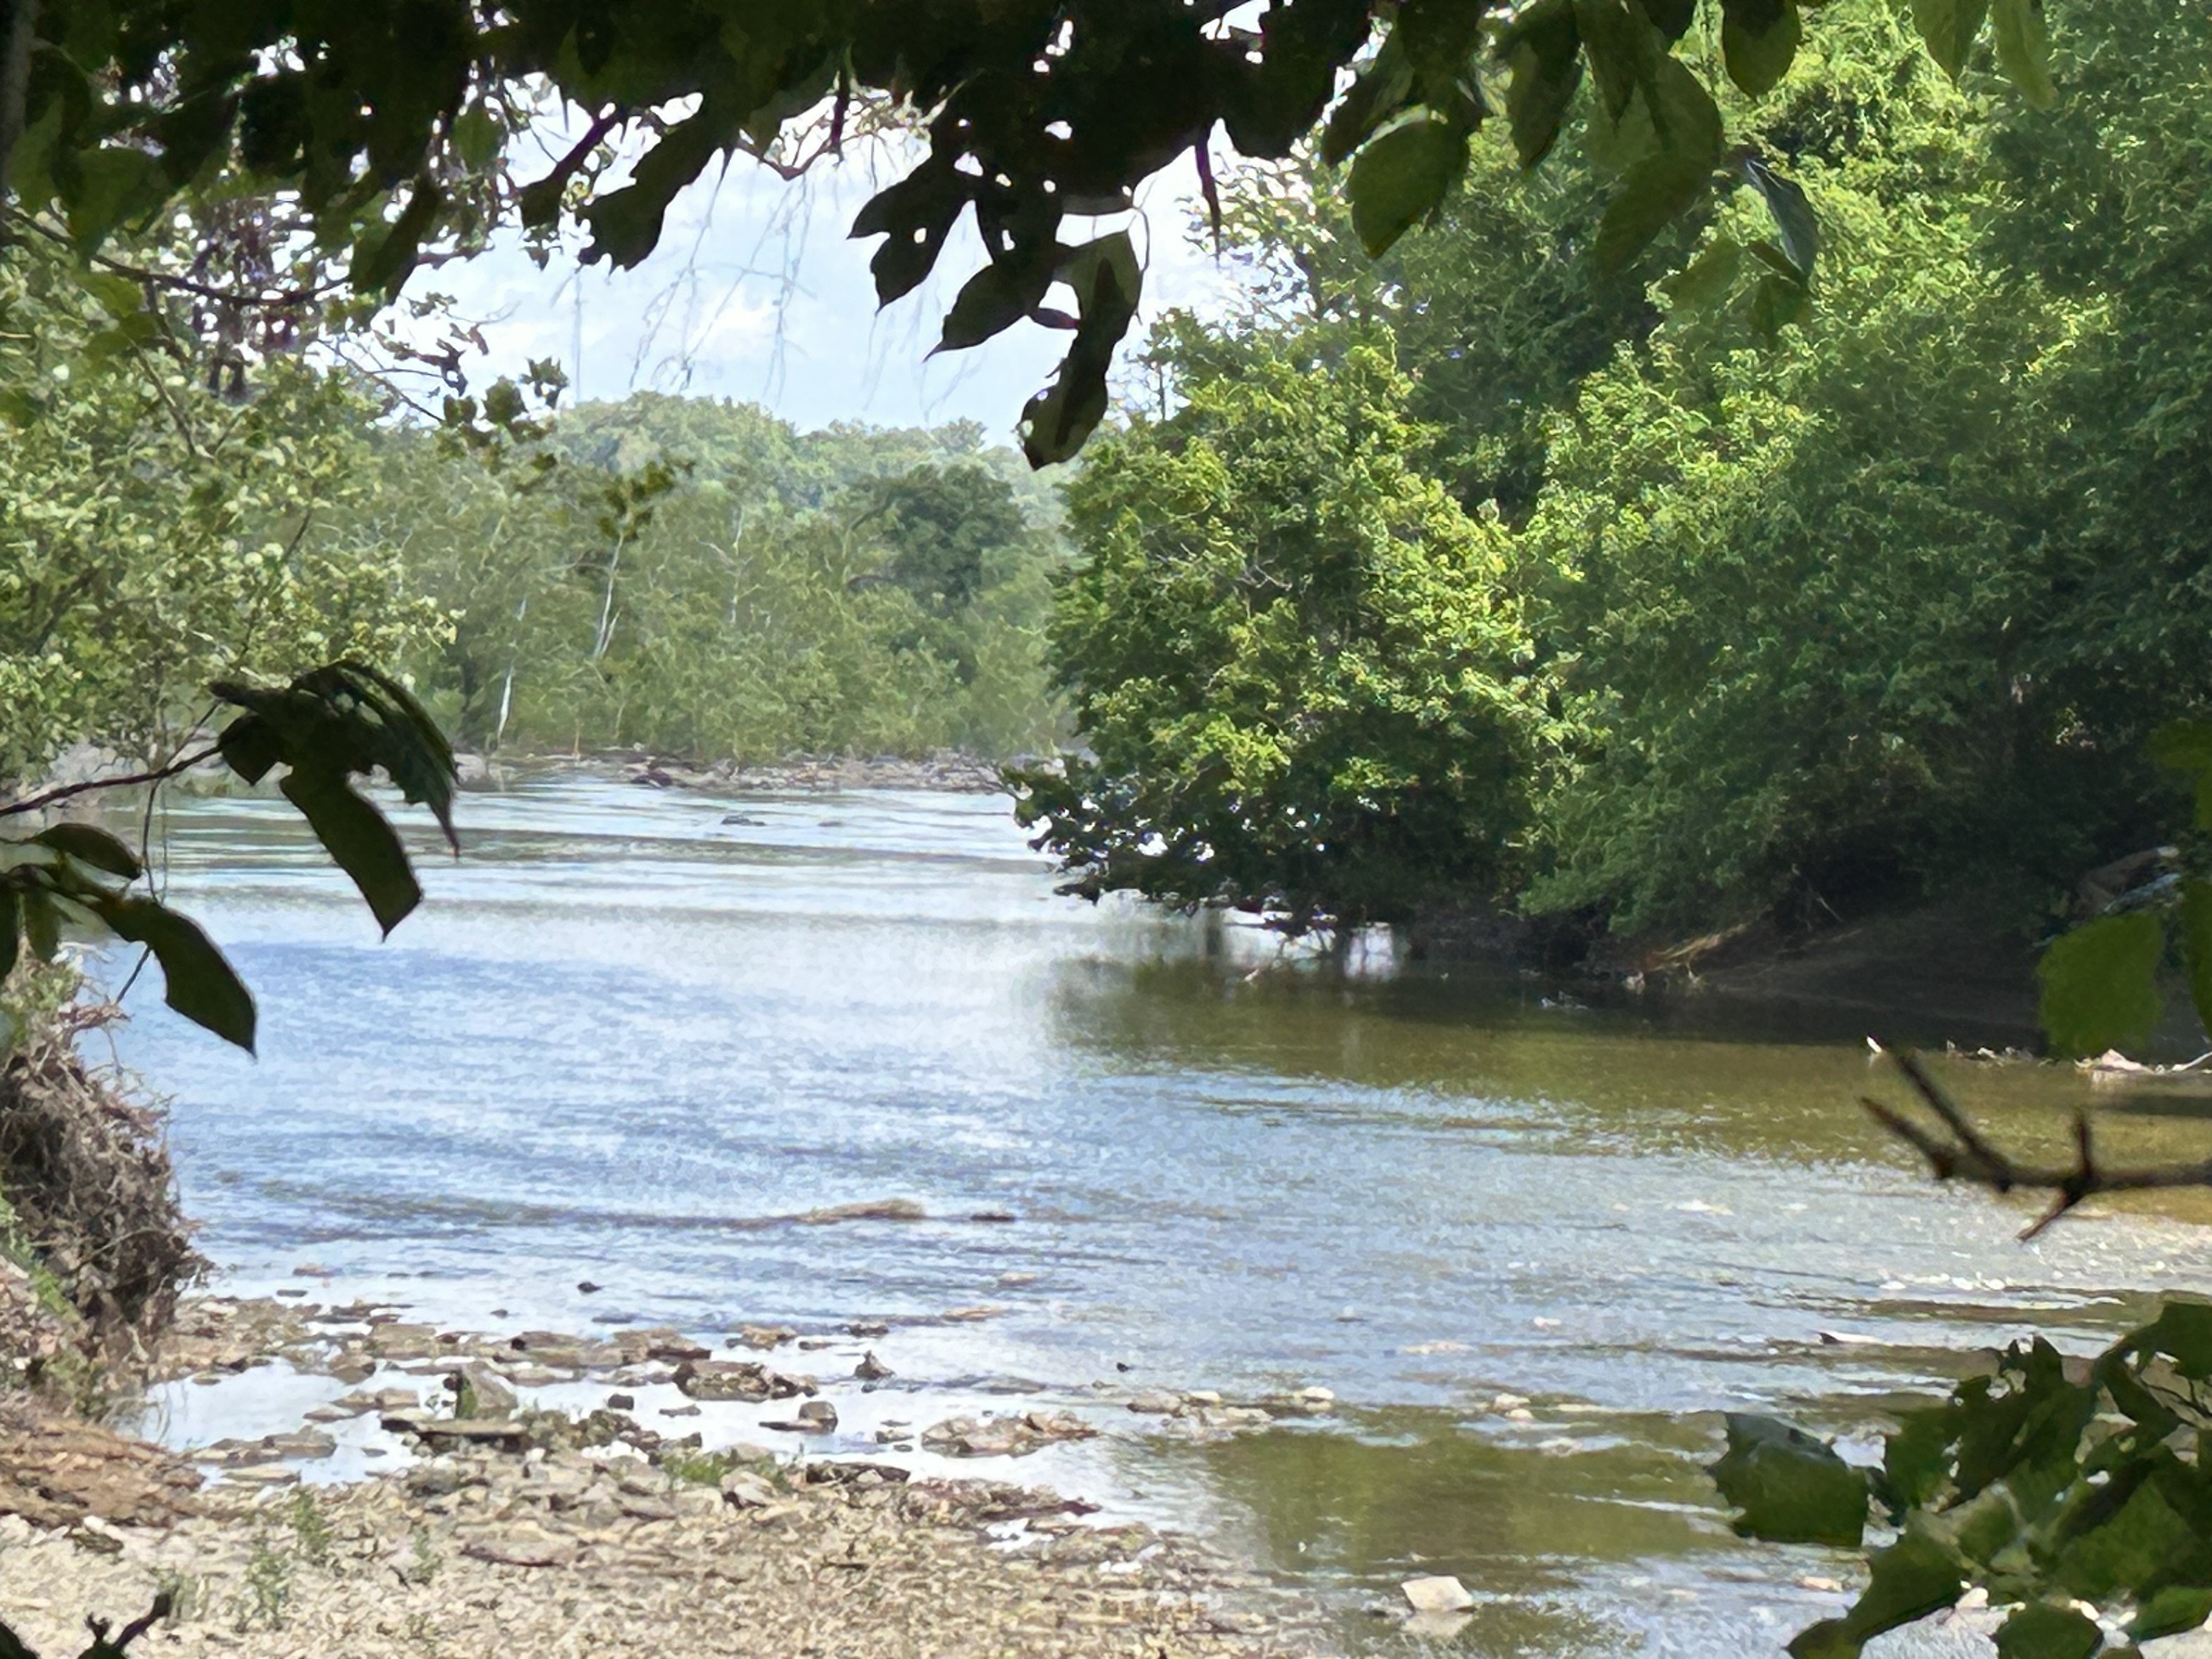 In response to the sewer overflow from the Potomac Interceptor collapse DC Water launched daily sampling on January 29, 2026, for E. coli, an indicator bacterium, at six (6) locations along the Potomac River and later expanded that to 10 sites. The locations included the overflow area as well as upstream and downstream sites.
Following more than five months of sampling, which has indicated a return to normal conditions in the Potomac River and the lifting of the remaining shoreline and sediment health advisories, DC Water ended weekend testing August 8, and moved to twice-a-week testing at the six Maryland locations August 18 - September 10.
The updated schedule included more detailed testing once a week. In addition to E. coli testing, Thursday samples measured oxygen levels, and test for nutrients, metals, and other substances that can affect water quality.
It's important to understand that rain, snow, heat, contaminated runoff, and natural sources of E. coli such as wildlife can cause higher bacteria levels in urban rivers such as the Potomac. After heavy rain experts recommend avoiding the water for at least 48-72 hours. This is reflected in the data, where significant spikes are seen that coincide with rain and weather events but then return to normal including sites upstream of the incident. With no overflows to the river for more than a month prior to completion of emergency repairs, fluctuations in measurements are more likely due to these known factors.
A more detailed explanation is posted on the District Department of Energy and Environment (DOEE) website at doee.dc.gov/release/potomac-interceptor-update-and-faqs
DC Water Locations - Water Quality Sampling
View DOEE's Potomac Interceptor Monitoring page to view comprehensive sampling results from regional agencies and organizations in DC, Maryland, and Virginia.
Expanded Water Quality Sampling Results
Between August 13 and September 10, DC Water sampled for a range of indicators that would give a comprehensive picture of river health, water pollution, and impact to aquatic life in the river. All of the results were well within normal ranges for the river. These measure include oxygen levels, nutrients, metals, and others listed below:
- Dissolved Oxygen (DO) - If oxygen levels are too low it is an indicator of poor water quality and is harmful to aquatic life.
- pH - Measures how acidic or basic the water is and may indicate contamination that may be harmful to fish, plants, or microorganisms.
- Hardness - Measures the dissolved calcium and magnesium minerals in water, which affects aquatic life.
- Copper and Zinc - Indicates the level of heavy metal pollution and risk to aquatic life.
- Total Suspended Solids (TSS) - Solid particles of organic matter such as human waste, food particles, biological sludge, or bacteria that indicate water clarity and pollution.
- Total Nitrogen (TN) - Measures different forms of nitrogen which at high levels can contribute to algal blooms.
- Total Phosphorus (TP) - High phosphorus levels are indicators of nutrient pollution that can lead to algae growth and degrade water quality.
| Parameters | Detection Limit | Parameters | Detection Limit |
| Hardness (mg/L) | 1 | TSS (mg/L) | 2.3 to 3 |
| Copper (ug/L) | 2.0 | TN (mg/L) | 1 |
| Zinc (ug/L) | 15 | TP (mg/L) | 0.030 to 0.040 |
*Detection limit is the lowest level detectable
*ND= non-detect (result below detection limit)
| Paramaters |
Old Anglers Inn |
|||||
| 8/13/26 | 8/25/26 | 8/27/26 | 9/3/26 | 9/10/26 | AVERAGE | |
| DO (ppm) | 5.92 | 7.83 | 6.62 | 6.88 | 5.94 | 6.64 |
| Temperature (C) | 29.05 | 25.4 | 26.02 | 28.04 | 27.30 | 27.16 |
| pH | 8 | 7.46 | 8.33 | 8.27 | 8.61 | 8.18 |
| Hardness (mg/L) | 119 | 138 | 137 | 121 | 119 | 126.80 |
| Copper (ug/L) | ND | ND | ND | ND | ND | ND |
| Zinc (ug/L) | ND | ND | ND | ND | ND | ND |
| TSS (mg/L) | 17 | 9.8 | 5.1 | 14.1 | 2.5 | 9.70 |
| TN (mg/L) | ND | ND | ND | ND | ND | ND |
| TP (mg/L) | 0.040 | ND | ND | ND | ND | 0.040 |
| Paramaters | Near Drainage Channel @ Overflow (Swainson Island) | |||||
| 8/13/26 | 8/25/26 | 8/27/26 | 9/3/26 | 9/10/26 | AVERAGE | |
| DO (ppm) | 7.45 | 9.04 | 7.92 | 5.79 | 6.94 | 7.43 |
| Temperature (C) | 29.3 | 27.31 | 26.76 | 27.78 | 25.90 | 27.41 |
| pH | 8.49 | 8.65 | 8.5 | 8.26 | 8.37 | 8.45 |
| Hardness (mg/L) | 126 | 130 | 142 | 117 | 125 | 128.00 |
| Copper (ug/L) | ND | ND | ND | ND | 2.07 | 2.07 |
| Zinc (ug/L) | ND | ND | ND | ND | ND | ND |
| TSS (mg/L) | 11 | 5 | 5.9 | 5.0 | 14.3 | 8.28 |
| TN (mg/L) | 1 | 1.07 | ND | ND | ND | 1.04 |
| TP (mg/L) | 0.040 | ND | ND | ND | ND | 0.040 |
| Paramaters | Between Minnie's Island and north shore of Potomac River | |||||
| 8/13/26 | 8/25/26 | 8/27/26 | 9/3/26 | 9/10/26 | AVERAGE | |
| DO (ppm) | 7.54 | 6.18 | 5.62 | 4.69 | 5.59 | 5.92 |
| Temperature (C) | 29.2 | 25.4 | 26.33 | 27.56 | 26.17 | 26.93 |
| pH | 8.59 | 7.63 | 7.97 | 7.94 | 8.22 | 8.07 |
| Hardness (mg/L) | 125 | 135 | 130 | 117 | 120 | 125.40 |
| Copper (ug/L) | ND | 2.79 | ND | ND | ND | 2.79 |
| Zinc (ug/L) | ND | ND | ND | ND | ND | ND |
| TSS (mg/L) | 15 | 18.3 | 10.4 | 3.5 | 3.0 | 10.04 |
| TN (mg/L) | 1.1 | ND | ND | ND | ND | 1.1 |
| TP (mg/L) | 0.056 | 0.083 | ND | ND | ND | 0.070 |
| Paramaters | South Side of Minnie's Island | |||||
| 8/13/26 | 8/25/26 | 8/27/26 | 9/3/26 | 9/10/26 | AVERAGE | |
| DO (ppm) | 7.50 | 8.12 | 7.40 | 8.50 | 7.73 | 7.85 |
| Temperature (C) | 29.2 | 26.59 | 26.89 | 28.32 | 26.94 | 27.59 |
| pH | 8.57 | 8.64 | 8.55 | 8.42 | 8.49 | 8.53 |
| Hardness (mg/L) | 120 | 133 | 131 | 117 | 120 | 124.20 |
| Copper (ug/L) | ND | ND | ND | ND | ND | ND |
| Zinc (ug/L) | ND | ND | ND | ND | ND | ND |
| TSS (mg/L) | 17 | 9.8 | 7.9 | 4.4 | 3.3 | 8.48 |
| TN (mg/L) | ND | ND | ND | ND | ND | ND |
| TP (mg/L) | 0.038 | ND | ND | ND | ND | 0.038 |
| Paramaters | Sycamore Island | |||||
| 8/13/26 | 8/25/26 | 8/27/26 | 9/3/26 | 9/10/26 | AVERAGE | |
| DO (ppm) | 6.36 | 6.51 | 6.67 | 5.49 | 5.88 | 6.18 |
| Temperature (C) | 28.13 | 25.14 | 26.26 | 27.07 | 26.51 | 26.62 |
| pH | 8.34 | 8.42 | 8.36 | 8.05 | 8.39 | 8.31 |
| Hardness (mg/L) | 118 | 133 | 131 | 115 | 120 | 123.40 |
| Copper (ug/L) | ND | 2.32 | 2.29 | 2.69 | ND | 2 |
| Zinc (ug/L) | ND | ND | ND | 15.1 | ND | 15.1 |
| TSS (mg/L) | 11 | 9.6 | 12.2 | 13.2 | 40.2 | 17.24 |
| TN (mg/L) | 1 | ND | 1 | ND | ND | 1 |
| TP (mg/L) | 0.044 | ND | ND | ND | ND | 0.044 |
| Paramaters | Lock 6 | |||||
| 8/13/26 | 8/25/26 | 8/27/26 | 9/3/26 | 9/10/26 | AVERAGE | |
| DO (ppm) | 6.22 | 8.41 | 6.18 | 6.85 | 7.43 | 7.02 |
| Temperature (C) | 28.7 | 28.14 | 26.36 | 27.91 | 26.98 | 27.62 |
| pH | 8.39 | 8.42 | 8.29 | 8.23 | 8.47 | 8.36 |
| Hardness (mg/L) | 113 | 135 | 129 | 114 | 118 | 121.80 |
| Copper (ug/L) | ND | ND | ND | ND | ND | ND |
| Zinc (ug/L) | ND | ND | ND | ND | ND | ND |
| TSS (mg/L) | 13 | 11.2 | 12 | 7.9 | 10.0 | 10.82 |
| TN (mg/L) | ND | ND | ND | ND | ND | ND |
| TP (mg/L) | 0.048 | ND | ND | ND | ND | 0.048 |
Bacteria Sampling Results
Sampling for E. coli was conducted between January 29, 2026 and September 10, 2026. The results can be found here.
Enhanced Water Quality Sampling
On Saturday, April 11, April 18, and April 25, DC Water performed enhanced water quality sampling at popular recreation areas along the Potomac River, testing every two hours. This proactive measure was intended to complement the daily water quality sampling already underway. It comes in response to community feedback and provides additional information to residents and recreational users about current river conditions.
E. coli (MPN/100 ml) |
||||||
|---|---|---|---|---|---|---|
| Sample Dates | Sample Times | Between Minnie's Island and north shore of Potomac River |
Sycamore Island | Lock 6 @ Feeder Canal | Fletcher's Boathouse | Three Sisters |
| 4/11/2026 | 8-10am | 15 | 10 | 30 | 65 | Not sampled |
| 10am-12pm | 46 | 22 | 68 | 25 | Not sampled | |
| 12pm-2pm | 32 | 45 | 42 | 12 | 2 | |
| 2pm-4pm | 8 | 55 | 33 | 8 | Not sampled | |
| 4pm-6pm | 36 | 18 | 16 | 45 | Not sampled | |
| 4/18/2026 | 8-10am | 37 | 33 | 10 | 15 | Not sampled |
| 10am-12pm | 32 | 28 | 11 | 20 | Not sampled | |
| 12pm-2pm | 14 | 44 | 5 | 20 | Not sampled | |
| 2pm-4pm | 16 | 36 | 9 | 50 | 12 | |
| 4pm-6pm | 20 | 38 | 6 | 64 | Not sampled | |
| 4/25/2026 | 8-10am | 30 | 36 | 6 | 185 | Not sampled |
| 10am-12pm | 22 | 9 | 5 | 32 | 1 | |
| 12pm-2pm | 10 | 6 | 1 | 15 | Not sampled | |
| 2pm-4pm | 5 | 5 | 1 | 26 | Not sampled | |
| 4pm-6pm | 8 | 5 | 1 | 5 | Not sampled | |
Understanding the Data and How it Compares
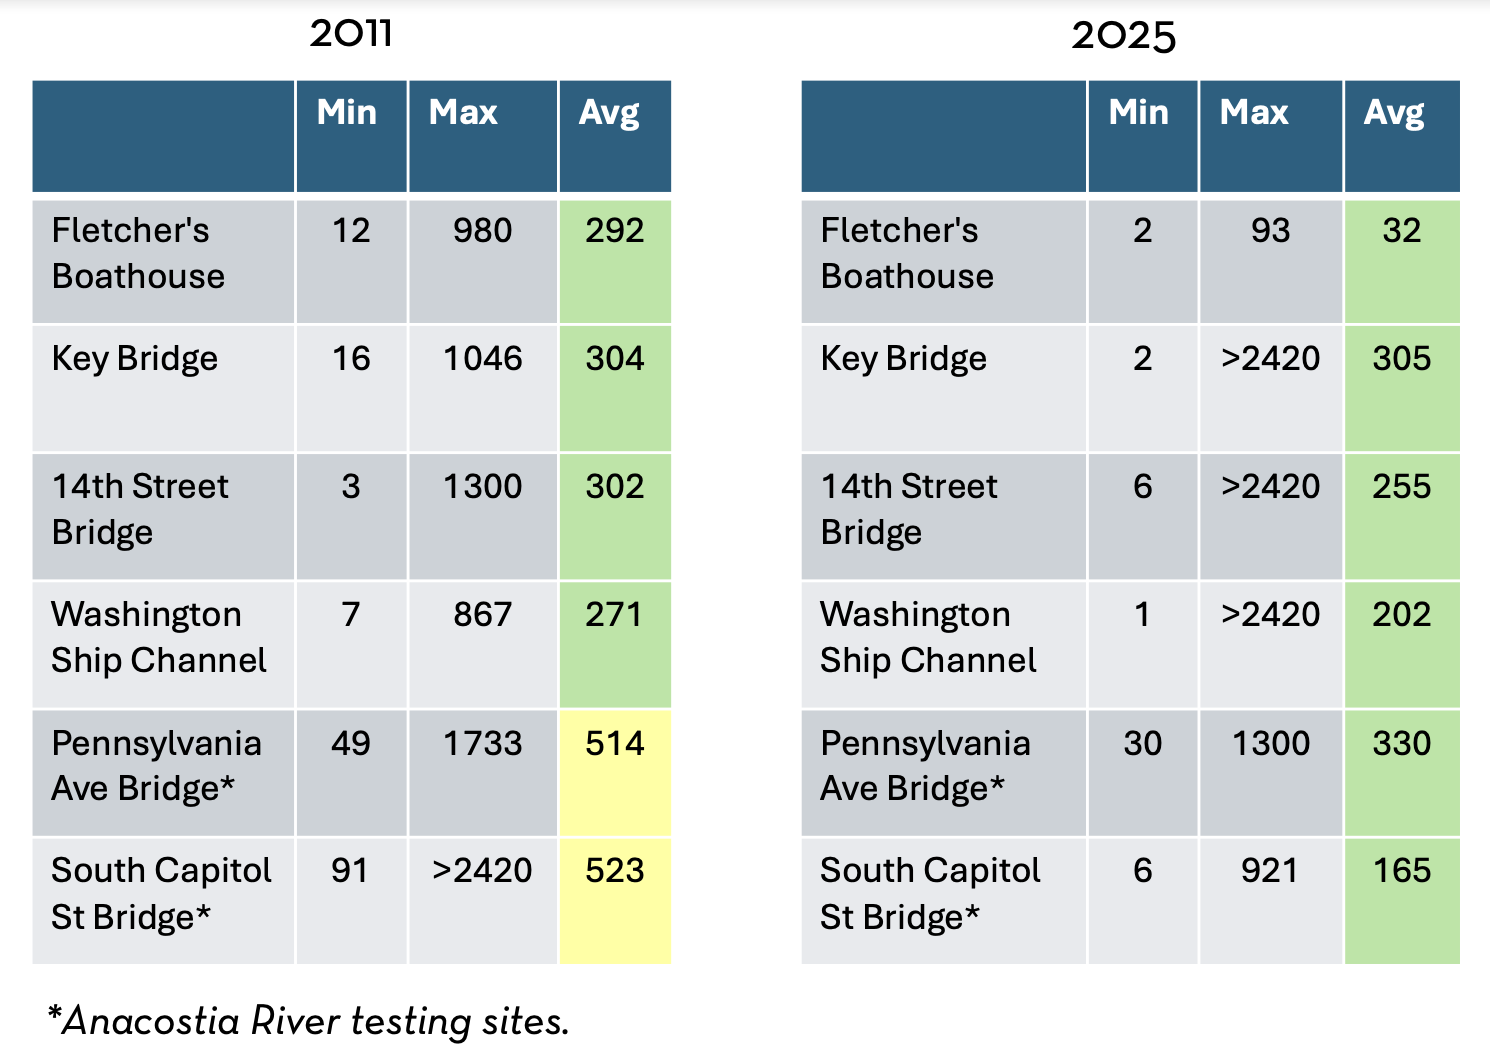
*Data Provided by DC Department of Energy and the Environment